
01 基本概念
1 概述
简介
Prometheus 就是一个时序数据库,每隔一段时间收集一次数据,连起来就是一段时间的监控数据。
一种多维数据模型,其中包含通过 metric 名称和键/值对标识的时间序列数据
- 可利用各种维度的灵活的查询语句 PromQL
- 不依赖分布式存储;单服务节点是自治的
- 时间序列通过 HTTP 拉取方式进行收集
- 支持通过中间网关推送时间序列
- 通过服务发现或静态配置发现目标
- 多种图形和仪表板支持模式
架构
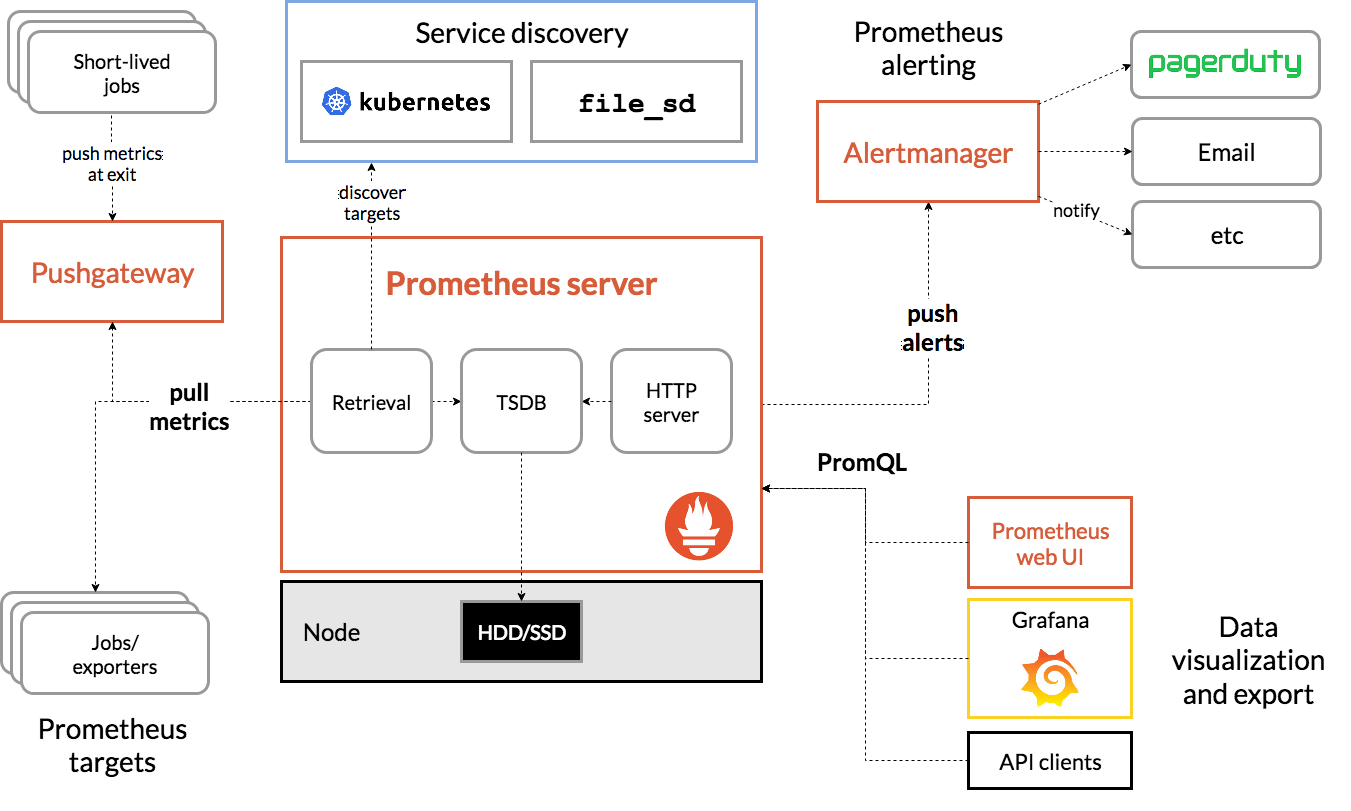
Prometheus 服务器
Prometheus Server 是 Prometheus组件中的核心部分,负责实现对监控数据的获取,存储以及查询。NodeExporter 业务数据源
业务数据源通过 Pull/Push 两种方式推送数据到 Prometheus Server。AlertManager 报警管理器
Prometheus 通过配置报警规则,如果符合报警规则,那么就将报警推送到 AlertManager,由其进行报警处理。可视化监控界面
Prometheus 收集到数据之后,由 WebUI 界面进行可视化图标展示。目前我们可以通过自定义的 API 客户端进行调用数据展示,也可以直接使用 Grafana 解决方案来展示。
2 核心概念
任务和实例
- job(任务名称,可以对应到应用名称)一组用于相同采集目的的实例,或者同一个采集进程的多个副本则通过一个一个任务(Job)进行管理。
- targets(不同目标,可以对应到不同的节点)可以访问http://192.168.33.10:9090/targets 直接从Prometheus的UI中查看当前所有的任务以及每个任务对应的实例信息。
1 | scrape_configs: |
样本
在time-series中的每一个点称为一个样本(sample),样本由以下三部分组成:
- 指标(metric):metric name和描述当前样本特征的labelsets;
- 时间戳(timestamp):一个精确到毫秒的时间戳;
- 样本值(value): 一个float64的浮点型数据表示当前样本的值。
1 | <--------------- metric ---------------------><-timestamp -><-value-> |
指标
在形式上,所有的指标(Metric)都通过如下格式标示:
1 | <metric name>{<label name>=<label value>, ...} |
- 指标的名称(metric name)可以反映被监控样本的含义(比如,http_request_total - 表示当前系统接收到的HTTP请求总量)。指标名称只能由ASCII字符、数字、下划线以及冒号组成并必须符合正则表达式[a-zA-Z_:][a-zA-Z0-9_:]*。metric_name(配置名称,对应一个指标)
- 标签(label)反映了当前样本的特征维度,通过这些维度Prometheus可以对样本数据进行过滤,聚合等。标签的名称只能由ASCII字符、数字以及下划线组成并满足正则表达式[a-zA-Z_][a-zA-Z0-9_]*。label(同一个指标的不同标签,可以是QPS种的方法名、不同的节点名称等、不同的Job应用名称等,类似于Excel的横向的维度。)
3 指标类型
Prometheus定义了4种不同的指标类型(metric type):Counter(计数器)、Gauge(仪表盘)、Histogram(直方图)、Summary(摘要)。
Counter:只增不减的计数器
Counter类型的指标其工作方式和计数器一样,只增不减(除非系统发生重置)。常见的监控指标,如http_requests_total,node_cpu都是Counter类型的监控指标。 一般在定义Counter类型指标的名称时推荐使用_total作为后缀。
- 通过rate()函数获取HTTP请求量的增长率:
1 | rate(http_requests_total[5m]) |
查询当前系统中,访问量前10的HTTP地址:
1 | topk(10, http_requests_total) |
Gauge:可增可减的仪表盘
Gauge类型的指标侧重于反应系统的当前状态。因此这类指标的样本数据可增可减。常见指标如:node_memory_MemFree(主机当前空闲的内容大小)、node_memory_MemAvailable(可用内存大小)都是Gauge类型的监控指标。
- 通过PromQL内置函数delta()可以获取样本在一段时间返回内的变化情况。例如,计算CPU温度在两个小时内的差异:
1 | delta(cpu_temp_celsius{host="zeus"}[2h]) |
- 使用deriv()计算样本的线性回归模型,甚至是直接使用predict_linear()对数据的变化趋势进行预测。例如,预测系统磁盘空间在4个小时之后的剩余情况:
1 | predict_linear(node_filesystem_free{job="node"}[1h], 4 * 3600) |
Histogram和Summary分析数据分布情况
通过Histogram和Summary类型的监控指标,我们可以快速了解监控样本的分布情况。请求处理的时间等。
- Histogram类型的样本会反应当前指标的记录的总数(以_count作为后缀)以及其值的总量(以_sum作为后缀)。Histogram指标直接反应了在不同区间内样本的个数,区间通过标签len进行定义。
1 | # HELP prometheus_tsdb_compaction_chunk_range Final time range of chunks on their first compaction |
- 指标prometheus_tsdb_wal_fsync_duration_seconds的指标类型为Summary。 它记录了Prometheus Server中wal_fsync处理的处理时间,通过访问Prometheus Server的/metrics地址,可以获取到以下监控样本数据:
1 | # HELP prometheus_tsdb_wal_fsync_duration_seconds Duration of WAL fsync. |
5 配置文件
configuration
https://prometheus.io/docs/prometheus/latest/configuration/configuration/
配置监控指标
https://prometheus.io/docs/prometheus/latest/configuration/recording_rules/
配置告警指标
https://prometheus.io/docs/prometheus/latest/configuration/alerting_rules/